How to read a periodontal chart
A periodontal chart packs a lot onto one page: six numbers per tooth for probing depth, more for the gingival margin, dots for bleeding and plaque, and grades for mobility and furcation. This page explains each row, how to turn them into clinical attachment level and a bleeding score, and how they feed into the 2017 classification.
It's written as a quick reference for dentists and dental students, from the 2017 AAP/EFP world workshop papers and the British Society of Periodontology's guidance. For the full criteria, read the sources at the bottom.
Updated
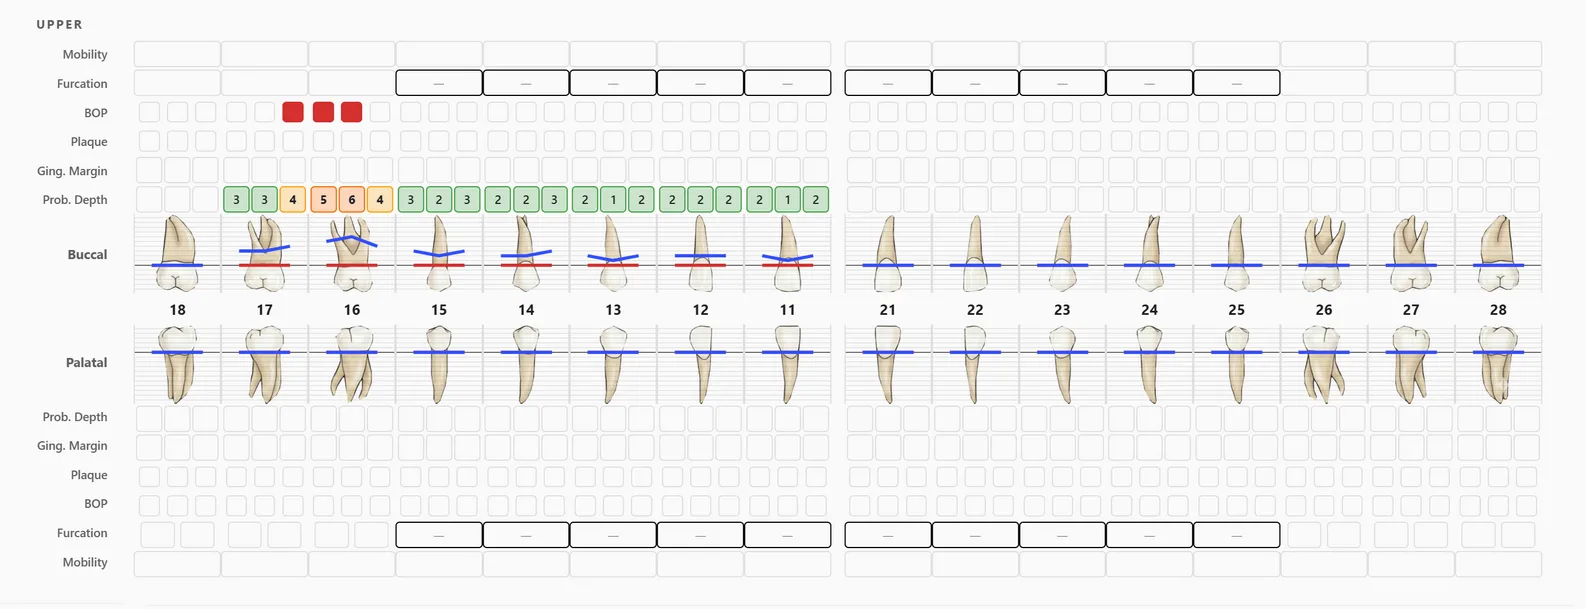
The layout: six sites per tooth
Each tooth is probed at six sites: mesiobuccal, buccal and distobuccal on the cheek side, and distolingual (or distopalatal), lingual and mesiolingual on the inner side. The chart shows the outer (buccal) and inner (palatal or lingual) readings on either side of a row of FDI tooth numbers, laid out as if you are facing the patient.
Above and below each tooth sit the per-tooth readings, mobility and furcation, and the per-site rows: bleeding on probing, plaque, gingival margin and probing depth.
Probing depth
Probing depth is the distance in millimetres from the gingival margin to the base of the pocket. In a healthy, intact periodontium the 2017 consensus describes probing depths of 3 mm or less, with fewer than 10% of sites bleeding.
Deeper readings are pockets. After treatment, the BSP flow chart treats residual pockets of 4 to 5 mm as sites to instrument again, and suggests considering referral for pockets of 6 mm or more. Probing depth alone doesn't tell you how much support has been lost, though; for that you need the gingival margin too.
Gingival margin and clinical attachment level
The gingival margin row records where the gum sits relative to the cementoenamel junction (CEJ). Charts differ in the sign they use, so check which convention a chart follows. A common one, and the one FindClinica's chart uses, records recession (margin below the CEJ) as a positive number and a margin above the CEJ (overgrowth, or a margin covering enamel) as a negative number.
With that convention, clinical attachment level (CAL) = probing depth + gingival margin. CAL is the real measure of attachment lost, because it is measured from a fixed point, the CEJ, rather than from the gum, which moves.
| Site | Probing depth | Gingival margin | CAL |
|---|---|---|---|
| Gum receded 2 mm below the CEJ | 4 mm | +2 | 6 mm |
| Gum at the CEJ | 6 mm | 0 | 6 mm |
| Gum 3 mm above the CEJ (overgrowth) | 9 mm | −3 | 6 mm |
Three sites with the same attachment loss. Examples from a clinical teaching module on attachment level.
The three sites look very different on probing depth alone, from a shallow 4 mm to a deep 9 mm, yet all have lost 6 mm of attachment.
Bleeding on probing (BOP)
Mark each site that bleeds within a few seconds of probing. The BOP score is the percentage of sites that bled: bleeding sites ÷ sites probed × 100. On a full chart of 28 teeth that's 168 sites, so 17 bleeding sites is about 10%.
Under the 2017 classification, a patient with an intact periodontium and BOP of 10% or more has gingivitis: localised at 10 to 30%, generalised above 30%. Below 10% with shallow pockets is gingival health.
The most useful thing about BOP is what its absence tells you. In Lang's study of maintenance patients, sites that didn't bleed had a negative predictive value of 98% for future attachment loss, while a bleeding site on its own predicted loss in only about 6% of cases. Sites that bled at every visit were far more likely to lose attachment than sites that never bled.
Plaque score
The plaque row marks the surfaces with plaque. O'Leary's plaque control record turns it into a percentage: surfaces with plaque ÷ surfaces examined × 100. It is mainly a teaching tool for the patient: show them the score, then show them the drop at the next visit. The BSP flow chart uses a plaque score of 20% or less as a sign that the patient is engaged with home care.
Mobility and furcation
Mobility is graded 0 to 3: 0 is normal physiological movement, 1 slight, 2 moderate, and 3 severe, where the tooth also moves up and down in its socket.
Furcation involvement is recorded on multi-rooted teeth. Two systems are common.
| Grade | Glickman | Hamp |
|---|---|---|
| I | Incipient: the furcation can be felt but there is no real bone loss into it | Horizontal loss of support less than 3 mm |
| II | Bone lost into the furcation, but not all the way through | Horizontal loss of more than 3 mm, but not through and through |
| III | Through and through, but still covered by gum | Through and through |
| IV | Through and through and visible in the mouth | (not used) |
From a review of furcation classifications (Dentistry Journal, 2018).
From the chart to a diagnosis: stage and grade
The 2017 AAP/EFP classification stages periodontitis by severity and complexity, mainly from interdental CAL at the worst site, and grades it by rate of progression.
| Stage | Interdental CAL | Other key features |
|---|---|---|
| I | 1 to 2 mm | Radiographic bone loss under 15%; deepest pocket 4 mm or less |
| II | 3 to 4 mm | Bone loss 15 to 33%; deepest pocket 5 mm or less |
| III | 5 mm or more | Bone loss into the middle third of the root; up to 4 teeth lost to periodontitis; pockets of 6 mm or more, vertical defects, furcation class II or III |
| IV | 5 mm or more | As stage III, plus 5 or more teeth lost and a need for complex rehabilitation (chewing problems, bite collapse, fewer than 20 teeth) |
Simplified from the AAP's staging and grading chart. Extent is described as localised (under 30% of teeth), generalised, or molar/incisor pattern.
Grade estimates how fast the disease is progressing, from the bone loss at the worst site divided by the patient's age: under 0.25 is grade A (slow), 0.25 to 1.0 grade B (moderate), over 1.0 grade C (rapid). Smoking 10 or more cigarettes a day, or diabetes with HbA1c of 7% or more, moves the grade up. The guidance is to start from grade B and change it only with evidence.
How often to chart
Chart the full mouth before treatment and again at re-evaluation; the BSP flow chart re-evaluates about three months after the second step of therapy. For patients in maintenance, the BSP recommends recording full probing depths at least once a year, and the European S3 guideline recalls them every 3 to 12 months depending on their risk. Comparing the charts is the point: the same chart type, the same sites, a few months apart.
A chart on paper, or in the app
For a paper chart with exactly these rows, print the free periodontal chart. In FindClinica the same chart is built in: click a site and pick the number, deeper pockets are coloured, and each chart is saved as an initial exam, re-evaluation or maintenance visit on the patient's file, so the next comparison is one click away. Step by step: the perio chart in FindClinica.
Common questions
What is a normal probing depth?
In health, probing depths are 3 mm or less with fewer than 10% of sites bleeding. In a treated, stable periodontitis patient the consensus allows up to 4 mm, as long as no 4 mm site bleeds.
How do I calculate CAL?
Add the probing depth to the gingival margin, with recession recorded as a positive number and a margin above the CEJ as negative: CAL = PD + GM.
How is BOP % calculated?
The number of bleeding sites divided by the number of sites probed, times 100. Six sites on 28 teeth is 168 sites.
Does FindClinica calculate CAL?
No. It records probing depth and gingival margin for every site, so you can read or add CAL from them.
Read next
- Printable periodontal chart
- How to use the perio chart in FindClinica
- Printable dental chart and tooth numbering
- Dental clinic software in Pakistan
More for clinics in Pakistan
- Dental Clinic Software in Pakistan
- Clinic Management Software in Pakistan
- EMR Software in Pakistan for Small Clinics
- Prescription Software for Doctors in Pakistan
- Patient Record App for Doctors
- Paper Register vs Excel vs Clinic Software
- Best Clinic Software in Pakistan, Compared
- Clinic Management App for Android
- Clinic Software in Lahore
- Clinic Software in Karachi
- Clinic Software in Islamabad
- Software for Clinics With More Than One Doctor
- Online Prescription Maker for Doctors
- Software for Orthodontists in Pakistan
- Clinic Software That Works Offline
- Patient Complaint QR Code for Clinics
- Sentinel Event and Incident Reporting for Clinics
- Healthcare Waste Log for Clinics in Pakistan
- Patient Aftercare Instructions on WhatsApp
- Free Clinic Software for Windows
Free tools and templates
Sources
- Chapple et al., periodontal health and gingival diseases, 2017 World Workshop (J Clin Periodontol 2018)
- Trombelli et al., plaque-induced gingivitis: case definition (J Clin Periodontol 2018)
- Tonetti, Greenwell & Kornman, staging and grading of periodontitis (J Periodontol 2018)
- Papapanou et al., periodontitis consensus report (J Periodontol 2018)
- American Academy of Periodontology: staging and grading periodontitis (chart)
- Lang et al., absence of bleeding on probing as an indicator of periodontal stability (J Clin Periodontol 1990)
- Lang et al., bleeding on probing as a predictor of progression (J Clin Periodontol 1986)
- O'Leary et al., the plaque control record (J Periodontol 1972)
- Review of furcation involvement classifications (Dentistry Journal 2018)
- Clinical attachment level, advanced probing techniques (teaching module)
- British Society of Periodontology treatment flow chart
- BSP Basic Periodontal Examination guidelines (2019)
- Sanz et al., EFP S3 clinical practice guideline for stage I to III periodontitis (2020)
Try it with your next patient
The free plan costs nothing and has no time limit. Install it and add one patient, or ask us anything on WhatsApp first.